Pixell and Hub is an independent course aggregator. We may earn a commission when you click through.
Six Practical Routes Into Geospatial Data Analysis
Compare six focused learning paths, from satellite-image basics to Power BI, with clear guidance on Python, raster data, and career fit.
Quick Picks
Best starting point: Getting Started With Analyzing Satellite Imagery With Python for learners who need guided fundamentals.
Best hands-on Python lesson: Calculate an NDVI in Python because it turns remote-sensing theory into a concrete analysis.
Best general analytics route: Get Started With Microsoft Data Analytics for learners targeting Power BI rather than satellite imagery.
These six resources are not interchangeable. Five focus on Planet’s geospatial ecosystem, while Microsoft’s path shifts toward business intelligence. That split matters more than the rankings: the right course depends on whether you want to analyze Earth-observation data or build dashboards and reports.

Start With the Data Before the Code
The first decision is conceptual: do you understand the data you plan to analyze? Planet’s introductory resources move from geospatial data and metadata to raster manipulation, which is a sensible progression for beginners. The pages supplied for these courses do not list prices, duration, assessment details, or certificate terms, so treat them as focused learning resources rather than assume they carry a formal credential.
That missing information is the first practical insight. A course can teach a useful workflow without offering a certificate that employers recognize. Check the current course page before committing time, especially if a verified certificate matters for your career-change plan.
Geoprostorski Podatki
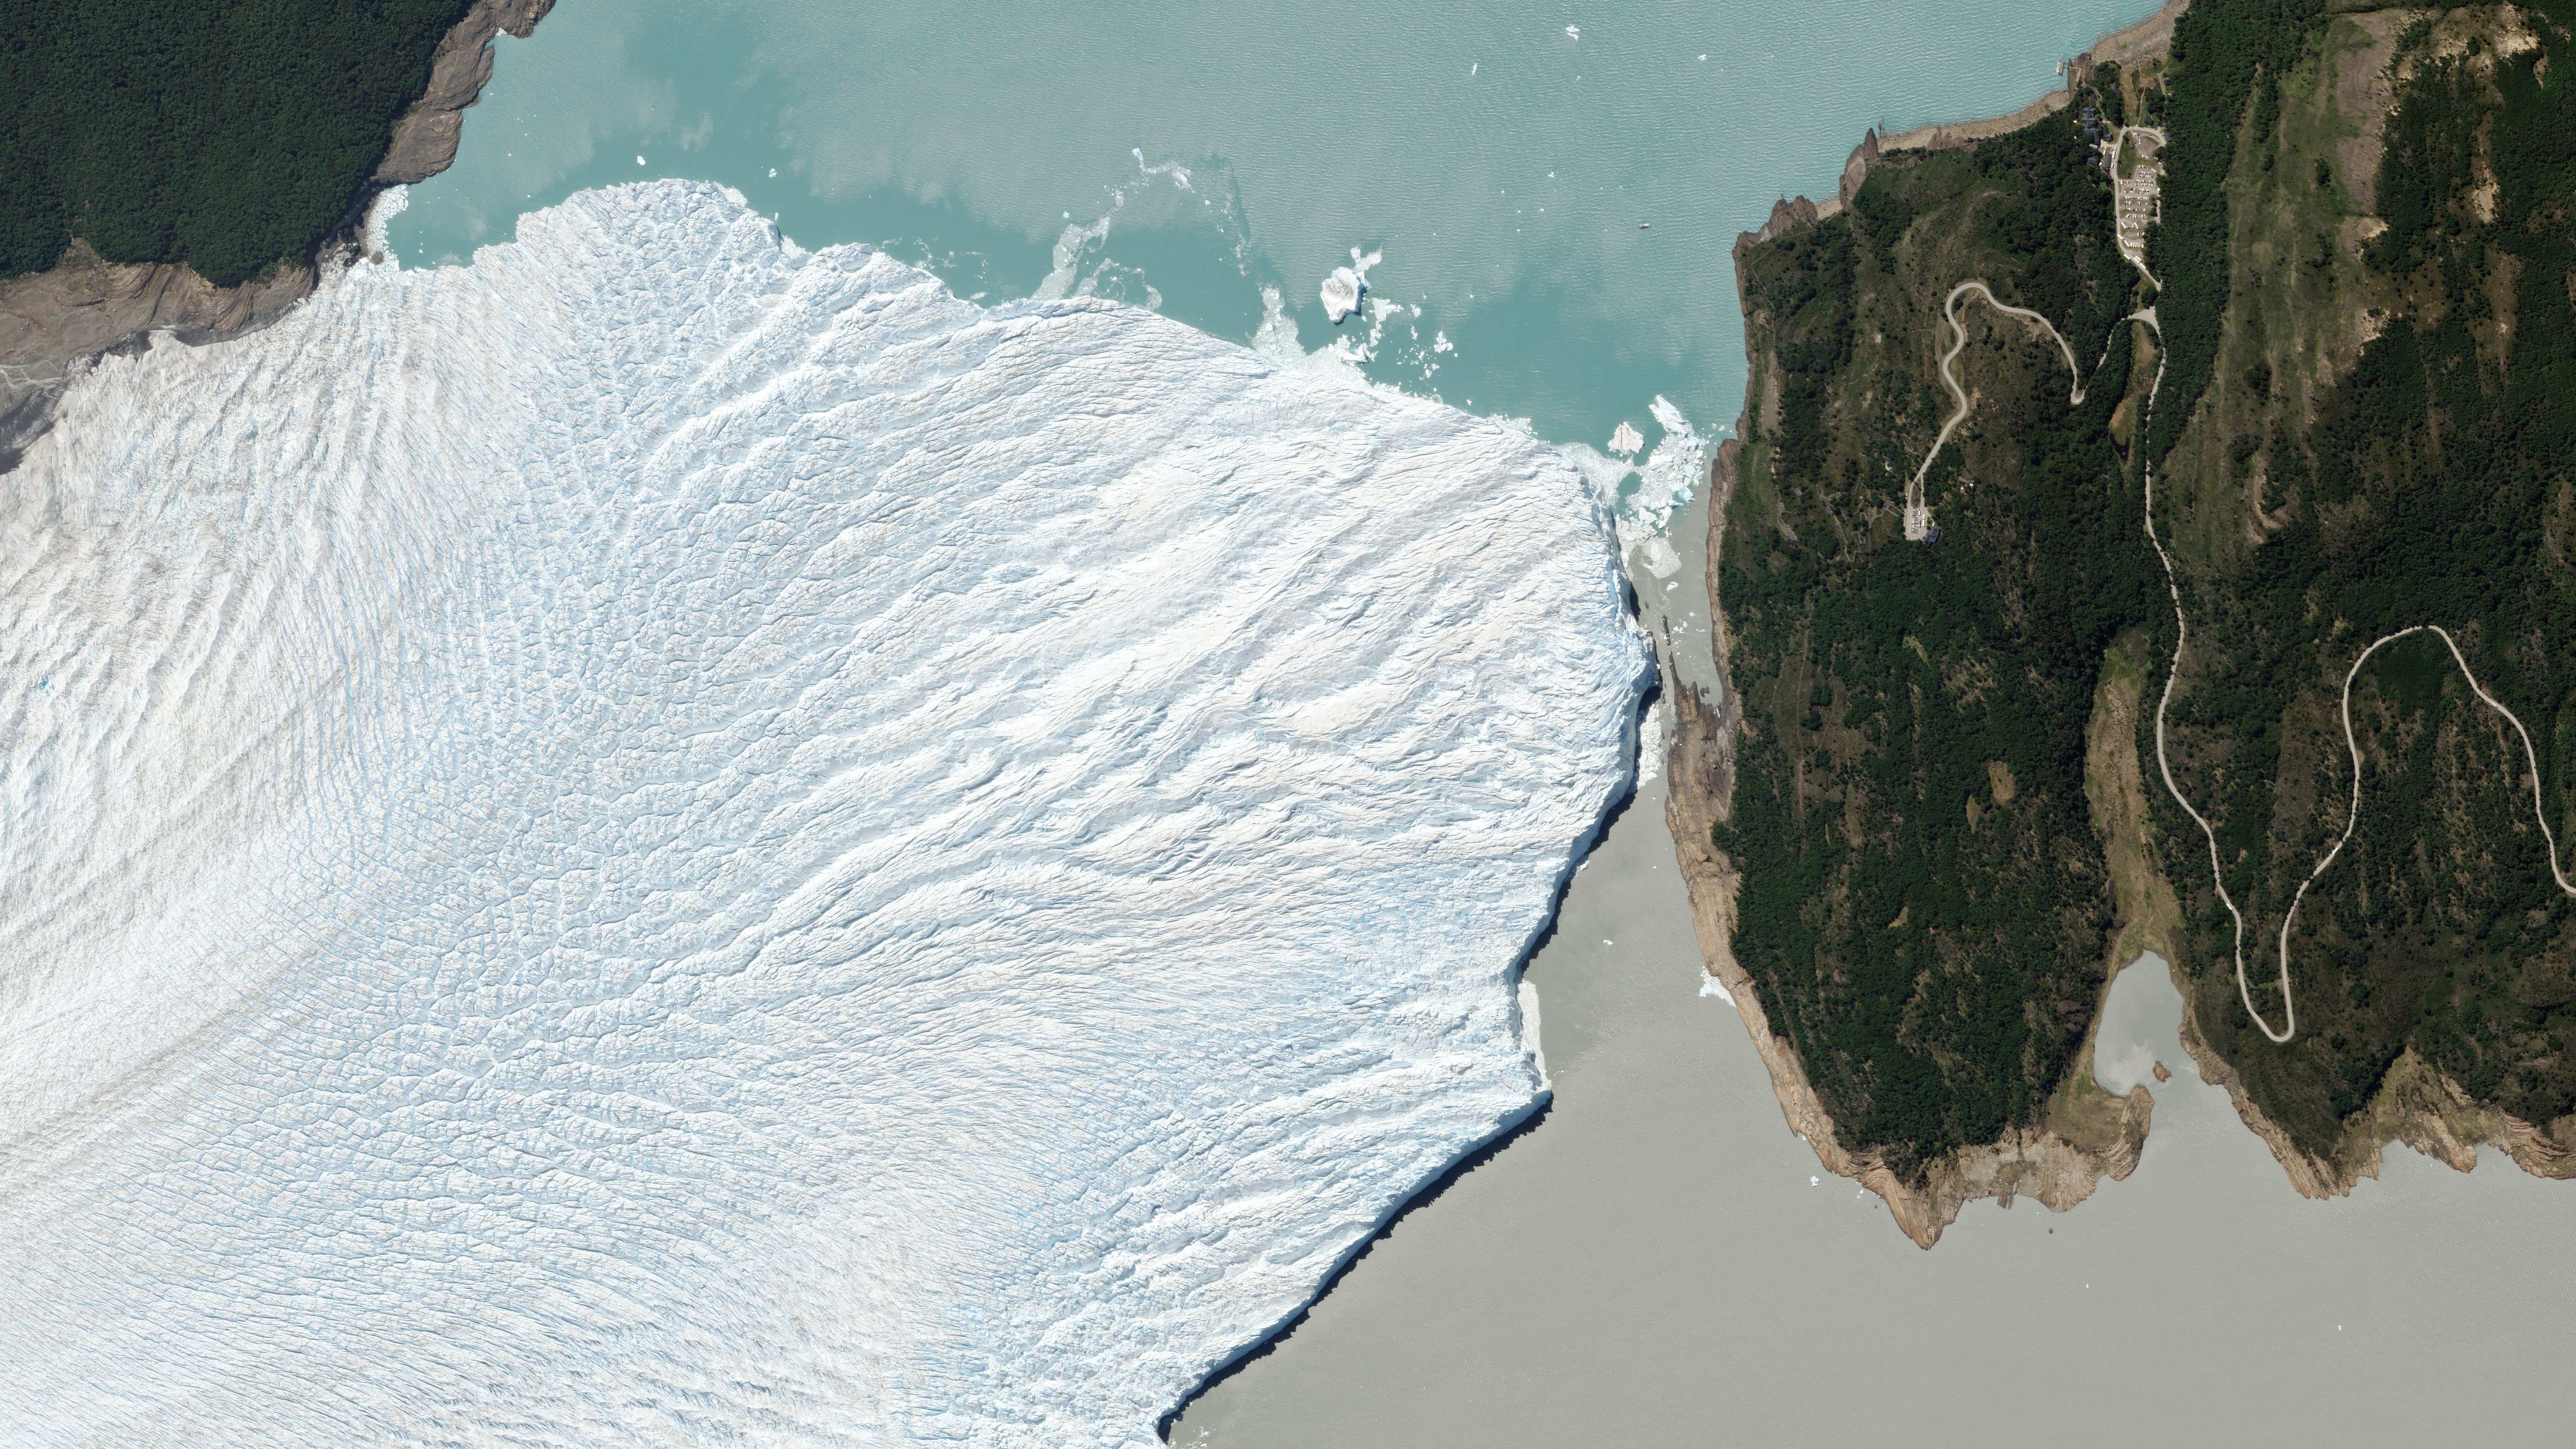
Geospatial Data is the broadest conceptual entry in the Planet group. It makes more sense before Python-heavy work because you first need to understand what location-based datasets represent. Compared with the metadata course, this title suggests wider coverage, but the supplied page content does not confirm modules, time commitment, price, or certificate status. Choose it if you are new to Earth-observation data and want vocabulary before opening a notebook.
Free Course on Multispectral Imagery and Metadata
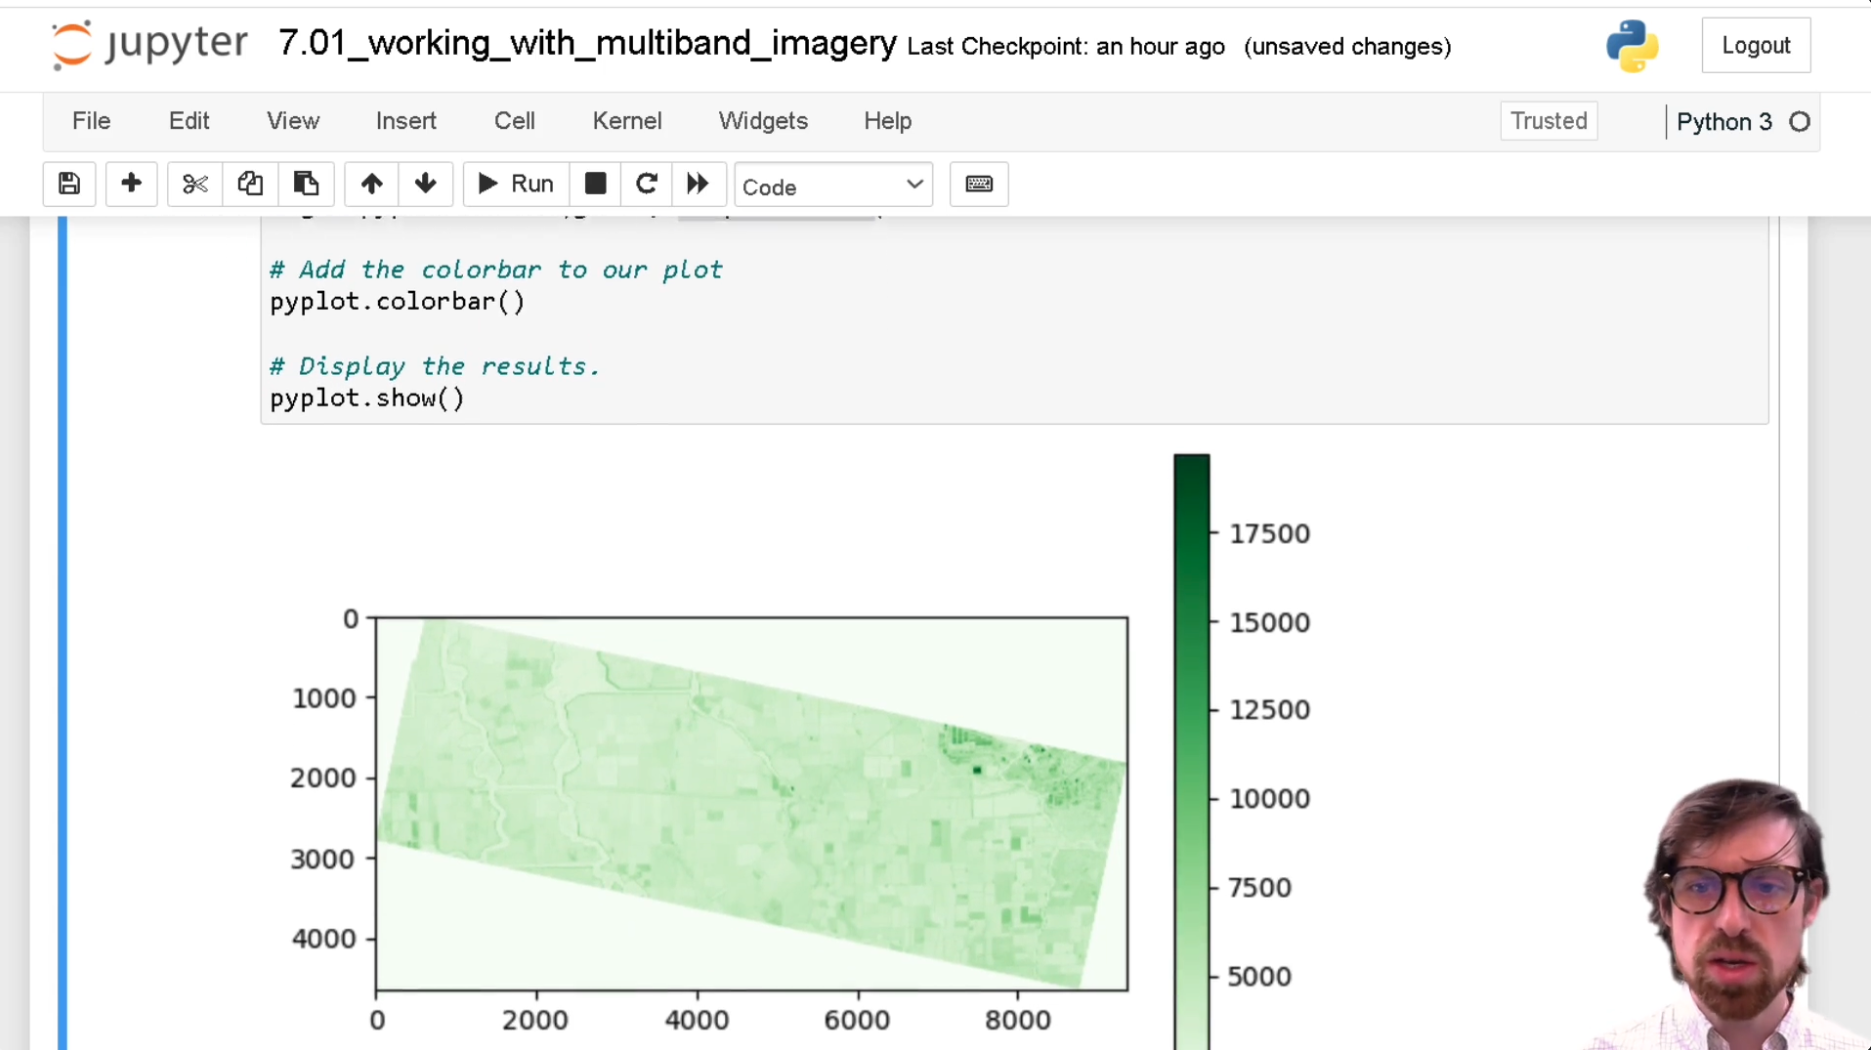
Multiband Imagery and Metadata is narrower and more technical than Geospatial Data. That focus is useful once you need to understand image bands, file context, and the information attached to satellite scenes. It is less suitable as a first analytics course because metadata rarely feels rewarding until you have a real analysis task in front of you. Pick this before raster processing if poor data interpretation is likely to undermine your later work.
The two resources above answer different beginner questions: what geospatial data is, and how satellite imagery is described. Neither page provides enough evidence to compare cost or credential value, so the strongest comparison is sequence. Start broad, then move into metadata before manipulating imagery.
That foundation leads naturally to the practical Python lessons. They are more concrete, but they also assume you are ready to work with technical concepts rather than simply browse examples.
Python Turns Remote Sensing Into Analysis
Python is the dividing line between passive familiarity and repeatable analysis. The NDVI lesson promises one defined outcome, while the broader satellite-imagery path appears to cover the surrounding workflow. If you are changing careers, a small reproducible analysis is usually more useful than another abstract introduction, provided you can explain the data and method behind it.
Izračunajte NDVI v Pythonu
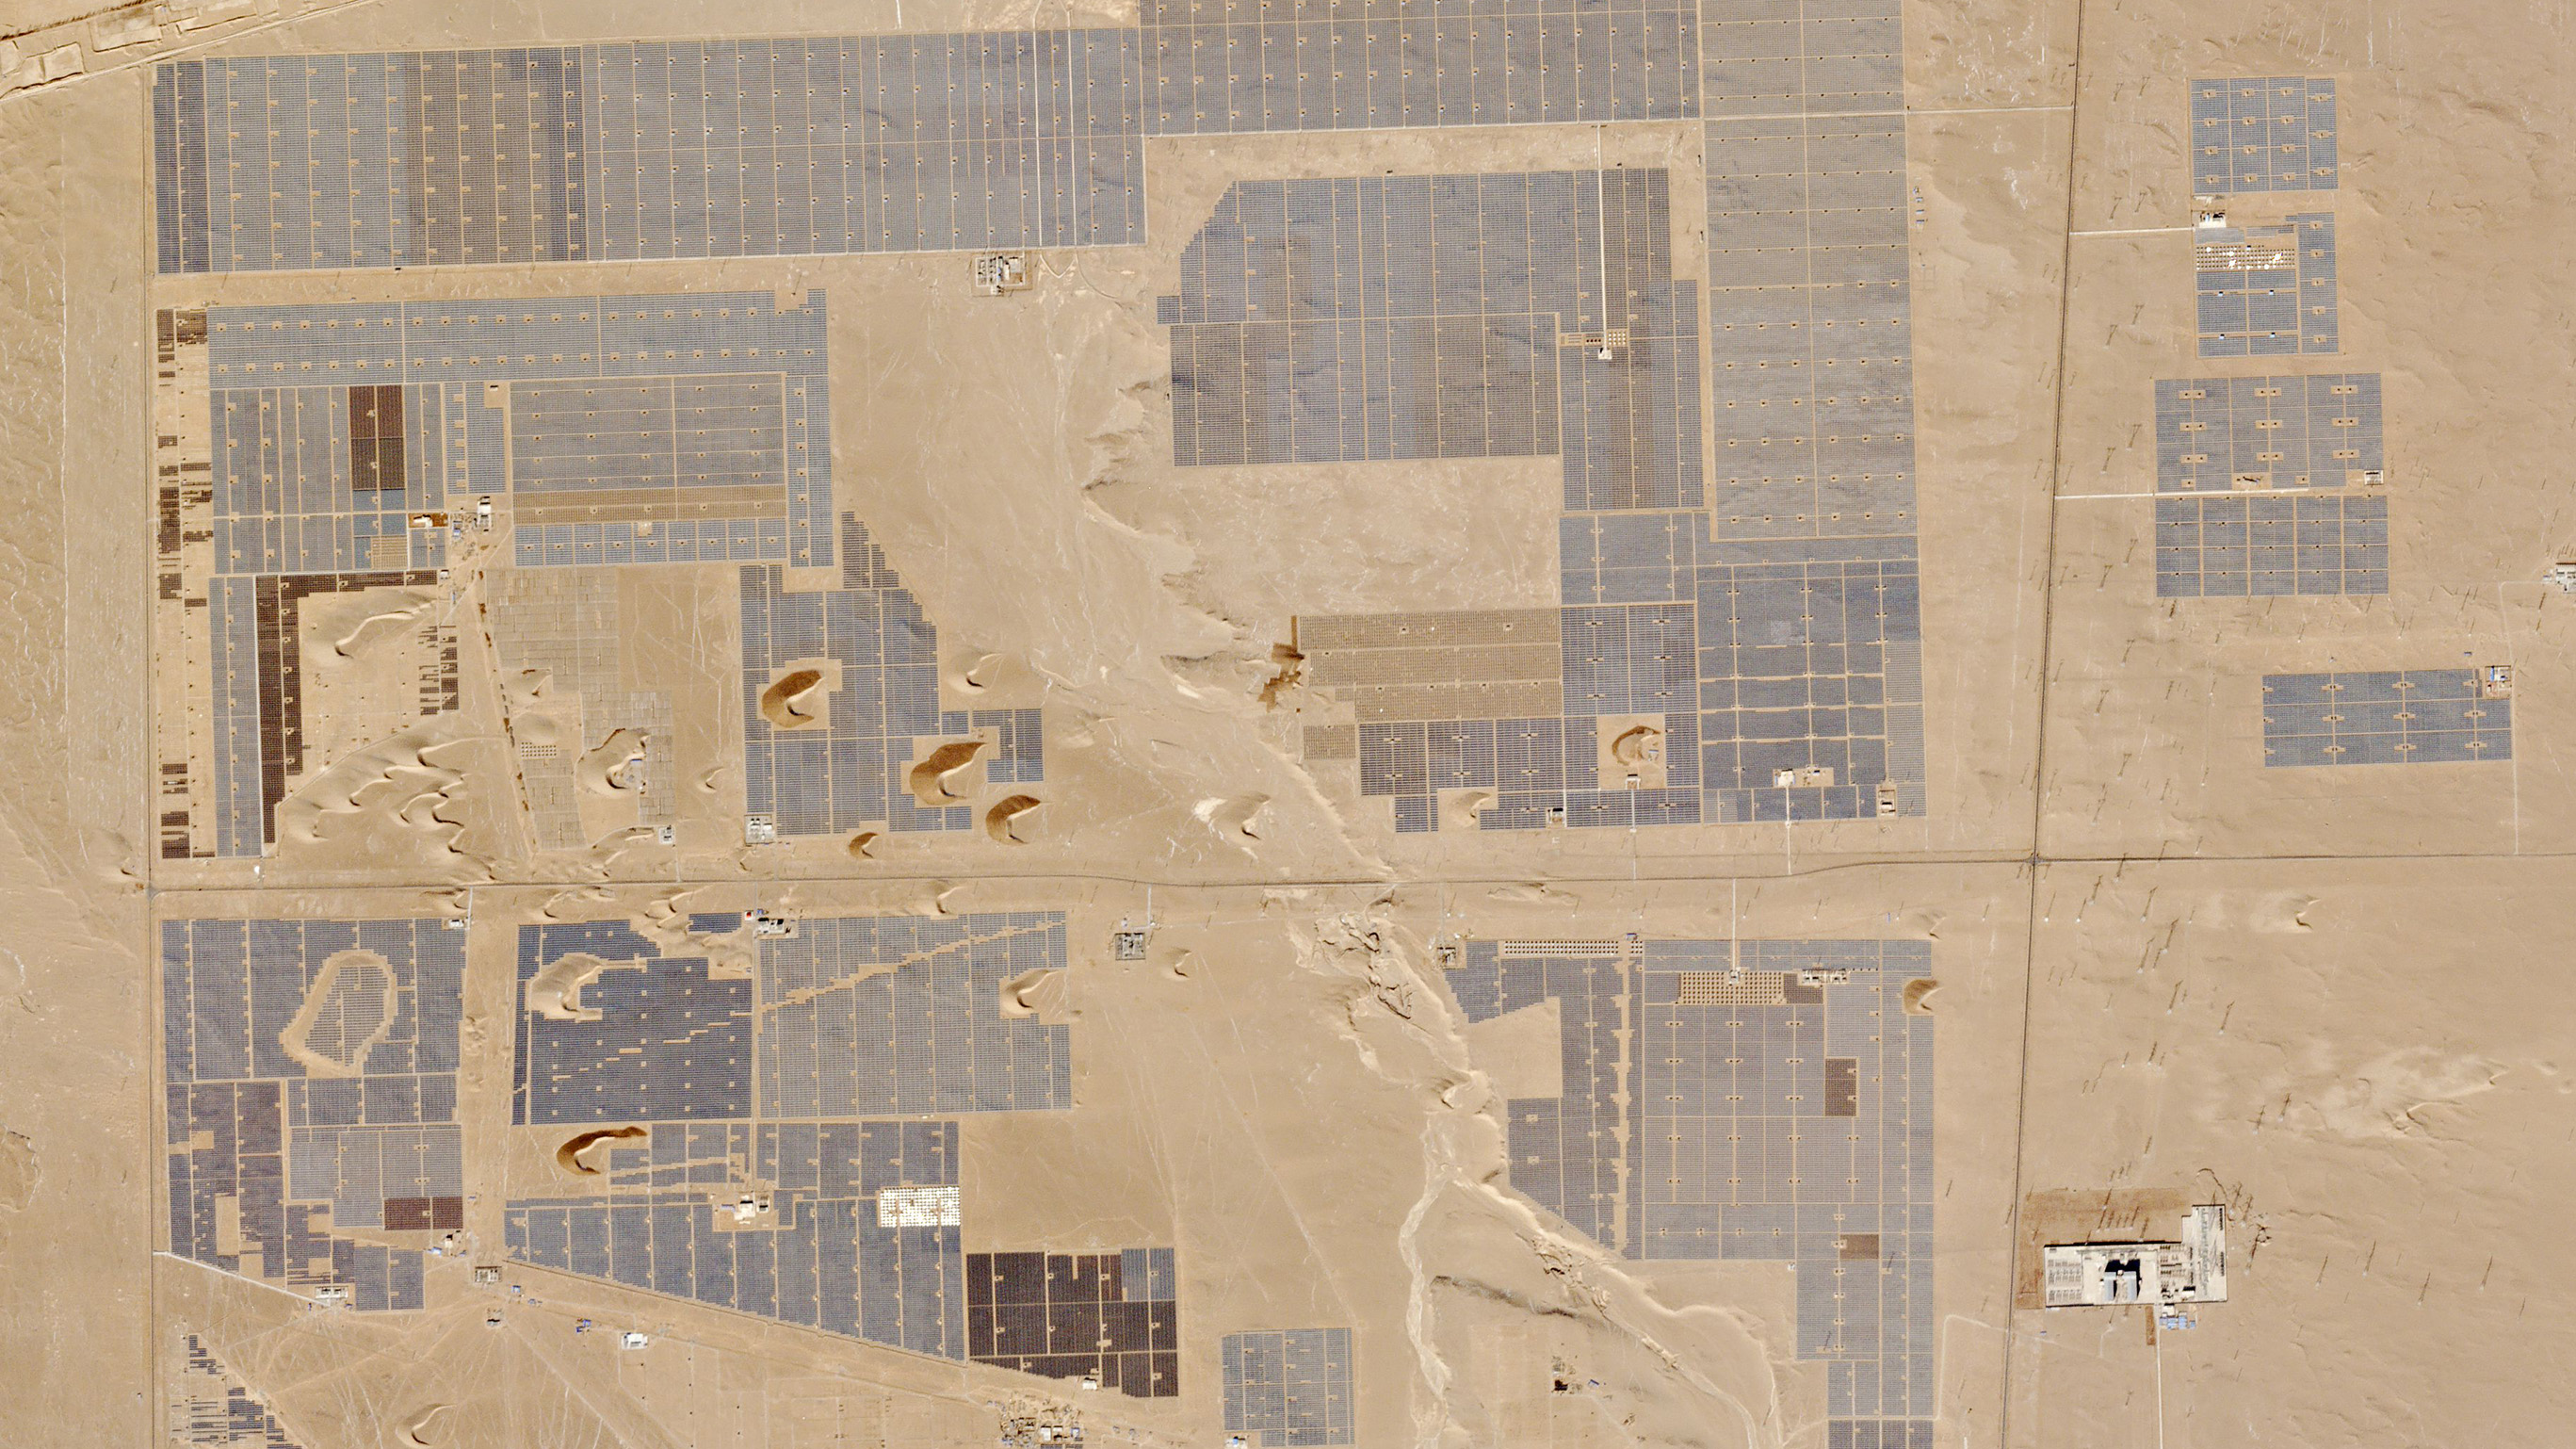
Calculate an NDVI in Python has the clearest practical endpoint in the set: producing a vegetation index with code. That narrow scope is an advantage for a first project because you can finish with something concrete to discuss in a portfolio. It will not replace a full Python or statistics curriculum, and the supplied listing does not state duration, price, prerequisites, or certificate terms. Use it after the data and metadata basics, not as a complete data-science program.
NDVI is a better test of applied learning than a generic programming title because it connects code to a domain question. Still, the lesson is intentionally narrow. If you need broader image-analysis practice, the next course covers more of the workflow and may justify the extra time even without published course metrics.
Uvod v analizo satelitskih posnetkov s Pythonom
Getting Started With Analyzing Satellite Imagery With Python is the strongest bridge between beginner concepts and a repeatable technical workflow. Compared with the NDVI lesson, it should give you broader context for loading, examining, and interpreting imagery, although the supplied page excerpt does not confirm the exact module list. Choose this route if you want one guided starting point rather than assembling several disconnected lessons.
The practical difference is scope. NDVI gives you a tightly bounded result; the satellite-imagery course appears to provide a wider on-ramp. I would pick the broader Python course for a career changer and the NDVI lesson for someone who already knows Python and wants a focused remote-sensing project.
Raster work sits beside both, not beneath them. It is the better next step when your challenge is transforming image data rather than understanding a single index.
Raster Skills and the Microsoft Alternative
Raster processing is where geospatial analysis becomes less tidy. Images have dimensions, bands, projections, and transformations that do not behave like a simple spreadsheet. Microsoft’s learning path belongs in the same comparison only because it represents a different analytics destination: Power BI and business reporting rather than satellite-image analysis.
Obdelava rastrskih slik
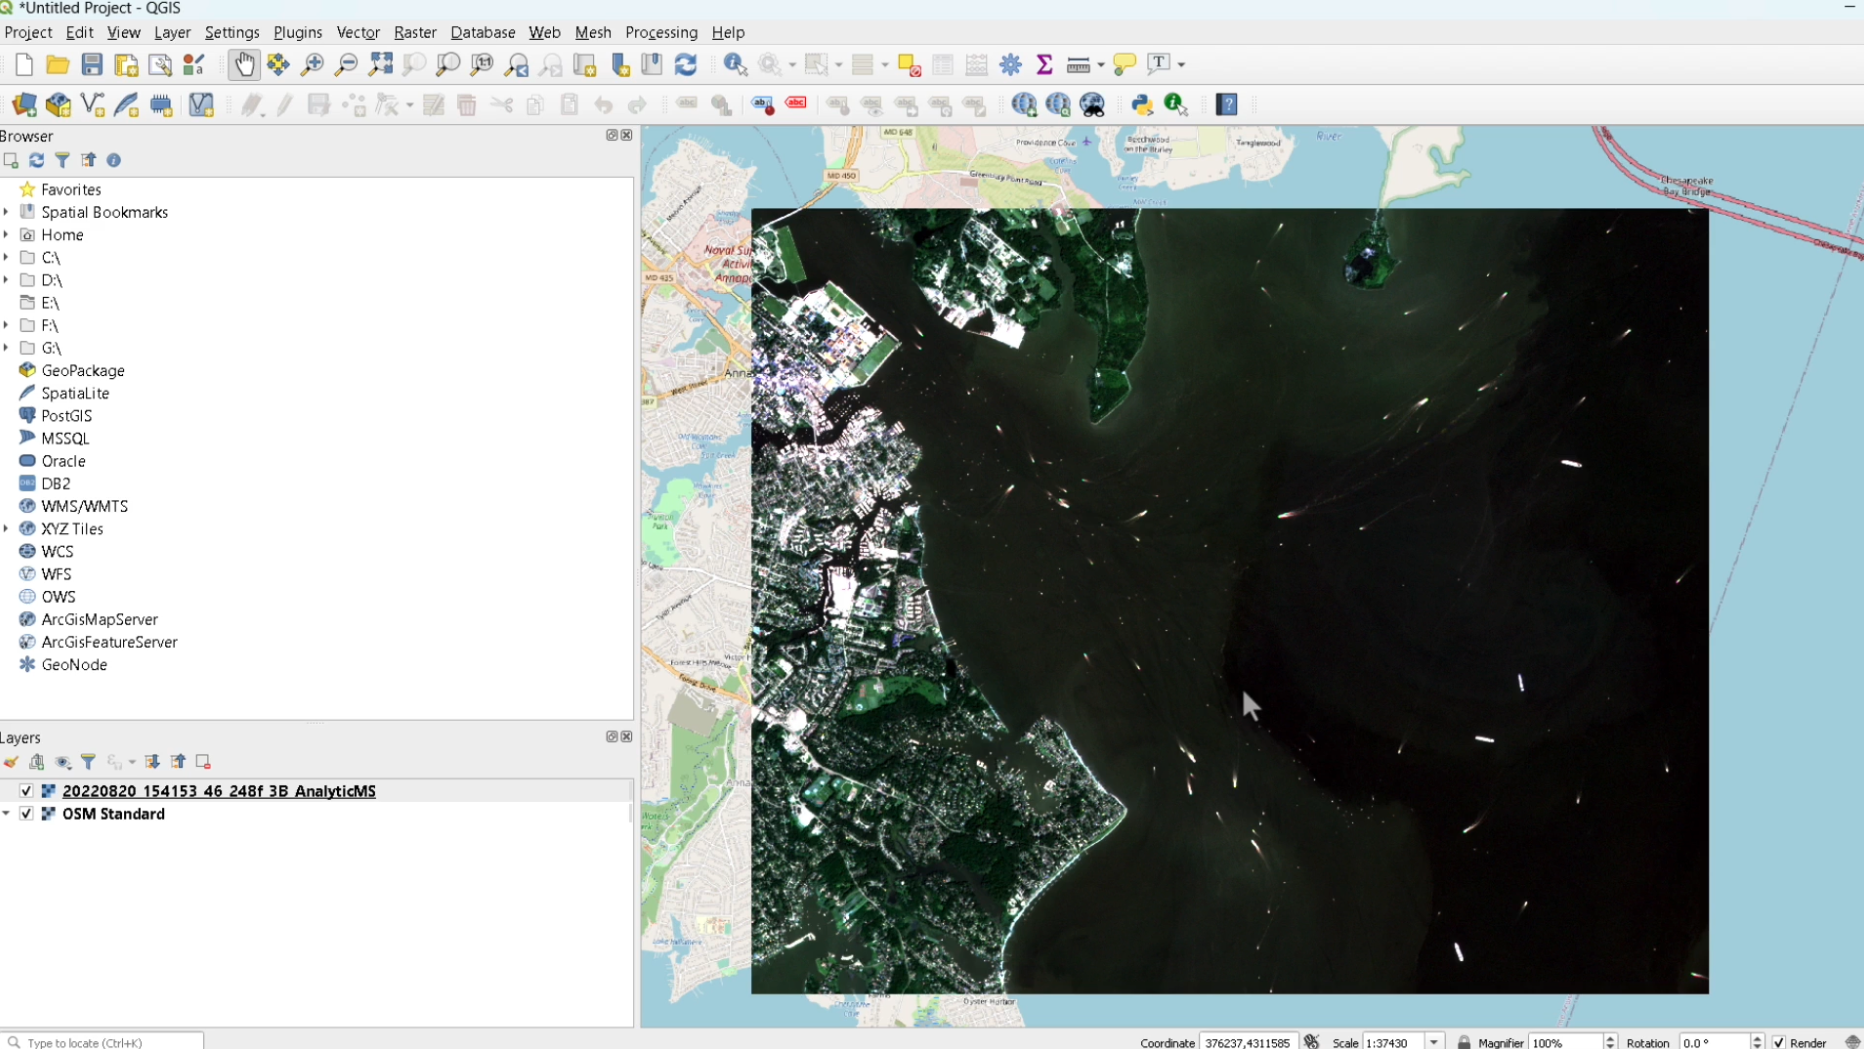
Manipulating Raster Images is the logical continuation after learning what imagery contains and how Python can inspect it. Its title points to hands-on transformation work, but the available listing does not reveal the exact operations, time requirement, price, or certificate conditions. Pick it if you already understand basic imagery and need to prepare raster data for analysis; beginners may find the earlier Python introduction easier to follow.
Microsoft Data Analytics Course
Microsoft’s Get Started with Microsoft Data Analytics is the outlier and the only listing with clear headline metrics in the supplied page content: 1 hour 28 minutes, 4 modules, intermediate level, and Power BI as the product. That makes the commitment easier to judge than the Planet pages. It is a better match for dashboard work and business reporting than satellite imagery, so do not choose it expecting geospatial Python practice.
The Microsoft path is the quickest defined commitment, but its intermediate label matters. A short course is not automatically beginner-friendly if it assumes familiarity with analytics or Power BI. By contrast, Planet’s pages offer a coherent geospatial sequence but disclose fewer details in the supplied listings.
For official details, compare the Planet University geospatial course page, the Planet NDVI lesson, and Microsoft’s data analytics learning path before enrolling. Those pages are the appropriate sources for current availability, language, course structure, and any certificate information.

Which Route Should You Take?
Choose Geospatial Data if you are starting from zero and need the broadest introduction to location-based information. Follow it with Multiband Imagery and Metadata before touching raster transformations.
Choose Getting Started With Analyzing Satellite Imagery With Python if you want a guided technical route and can handle basic programming concepts. Add the NDVI lesson when you need a compact portfolio exercise, then move to raster manipulation for deeper practice.
Choose Microsoft’s path if your target role involves Power BI dashboards, reporting, or general business analytics. The 1-hour-28-minute, four-module structure is the clearest time commitment in the group, but the intermediate level means it is not the safest first lesson for a complete beginner.
My pick for most aspiring geospatial analysts is the Python satellite-imagery course, followed by NDVI and raster work. For a broader analytics career, Microsoft is the more relevant destination. The key is not collecting six course completions; it is finishing one pathway with a project you can explain clearly.